UX DESIGN & ITERATION
UX DESIGN & ITERATION
SOFIT-
MEAL


A dedicated management tool for weight loss .
Finding the right balance between healthy eating & exercise, while experiencing how to sleep and stay hydrated play crucial roles in your weight-loss journey.
Calories management, social interactions and community engagement within the SoFit App will help user stay motivated and consistent towards their weight-loss goals.
With persistent encouragement and social engagement, SoFit makes it easier for you to form and maintain successful new habits.
Duration
8 months
My Role
Lead Product Designer
Tool
Figma - wireframing & prototyping
Adobe illustrator - icon
Miro - mind map & decision tree
My contribution
User research, Information architecture, Ideation, Wireframing, Prototyping, Iteration.
MEAL MODULE OVERVIEW
After we collect user BMI data, diet preference, personal activity level and weight loss goal in the onboarding stage, our professional nutritionist will conduct a customize plan to help users achieve their goal by a certain time.
The main functions of the meal module are tracking users' meals, calculating how many consumed calories, and remainings as a reference.
Target user groups
The target user groups specifications:
25-54 Female, Neutral. (Less Male, More towards Female)
-
People who are overweight have an objective of weight loss.
-
People who are just getting into the health and fitness world. They have little-to-no knowledge and are looking for information to get started.
User needs
😍 Easily log meals and calculate how many calories I consumed.
😍 Remind me how many calories I can take daily based on my weight loss goal.
😍 I‘d like to know how many calories and macronutrients I have taken every day.
😍 Need a clear chart to see the changes and how good or bad I did in past.
Information architecture

Scribbles & Wireframes
To better address user needs, I iterated the second version of low-fi wireframe based on old flow and UI
Old flow & UI

New flow & wireframe

Final Design

Log meals
-
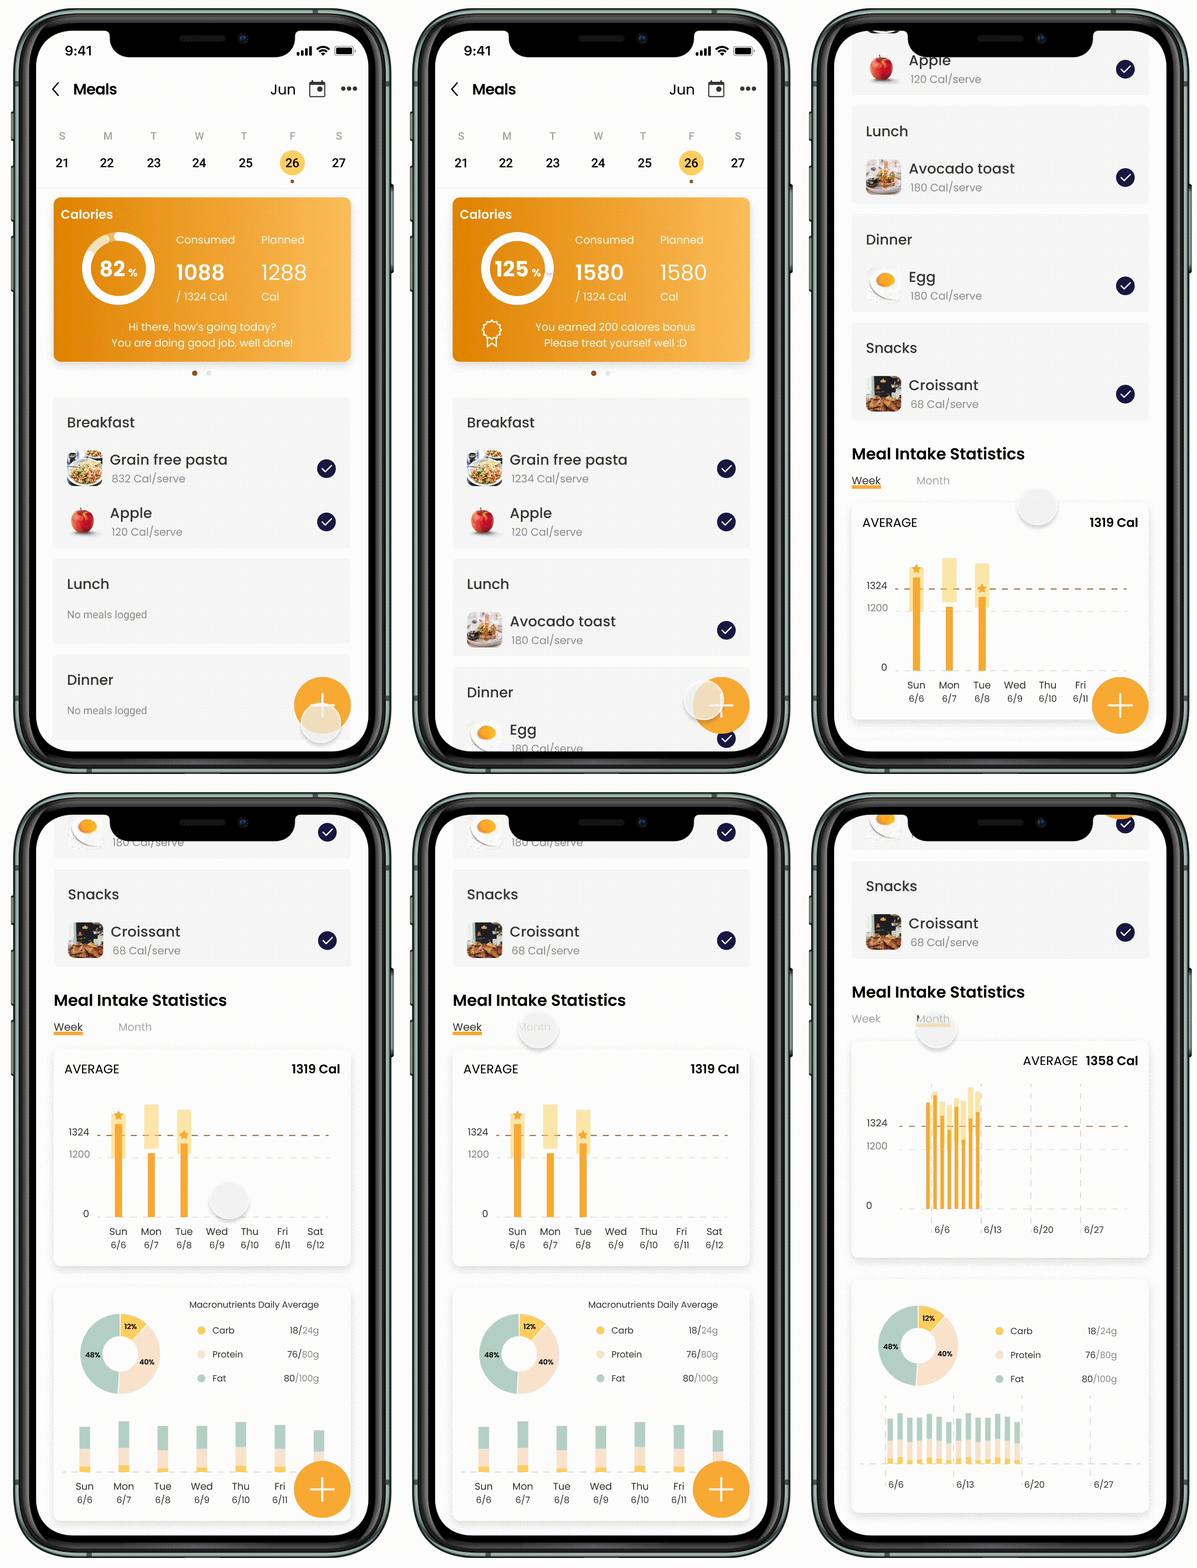
The top card presents the calories intake budget based on the user's BMI and weight loss goal (collect data in the onboarding stage).
-
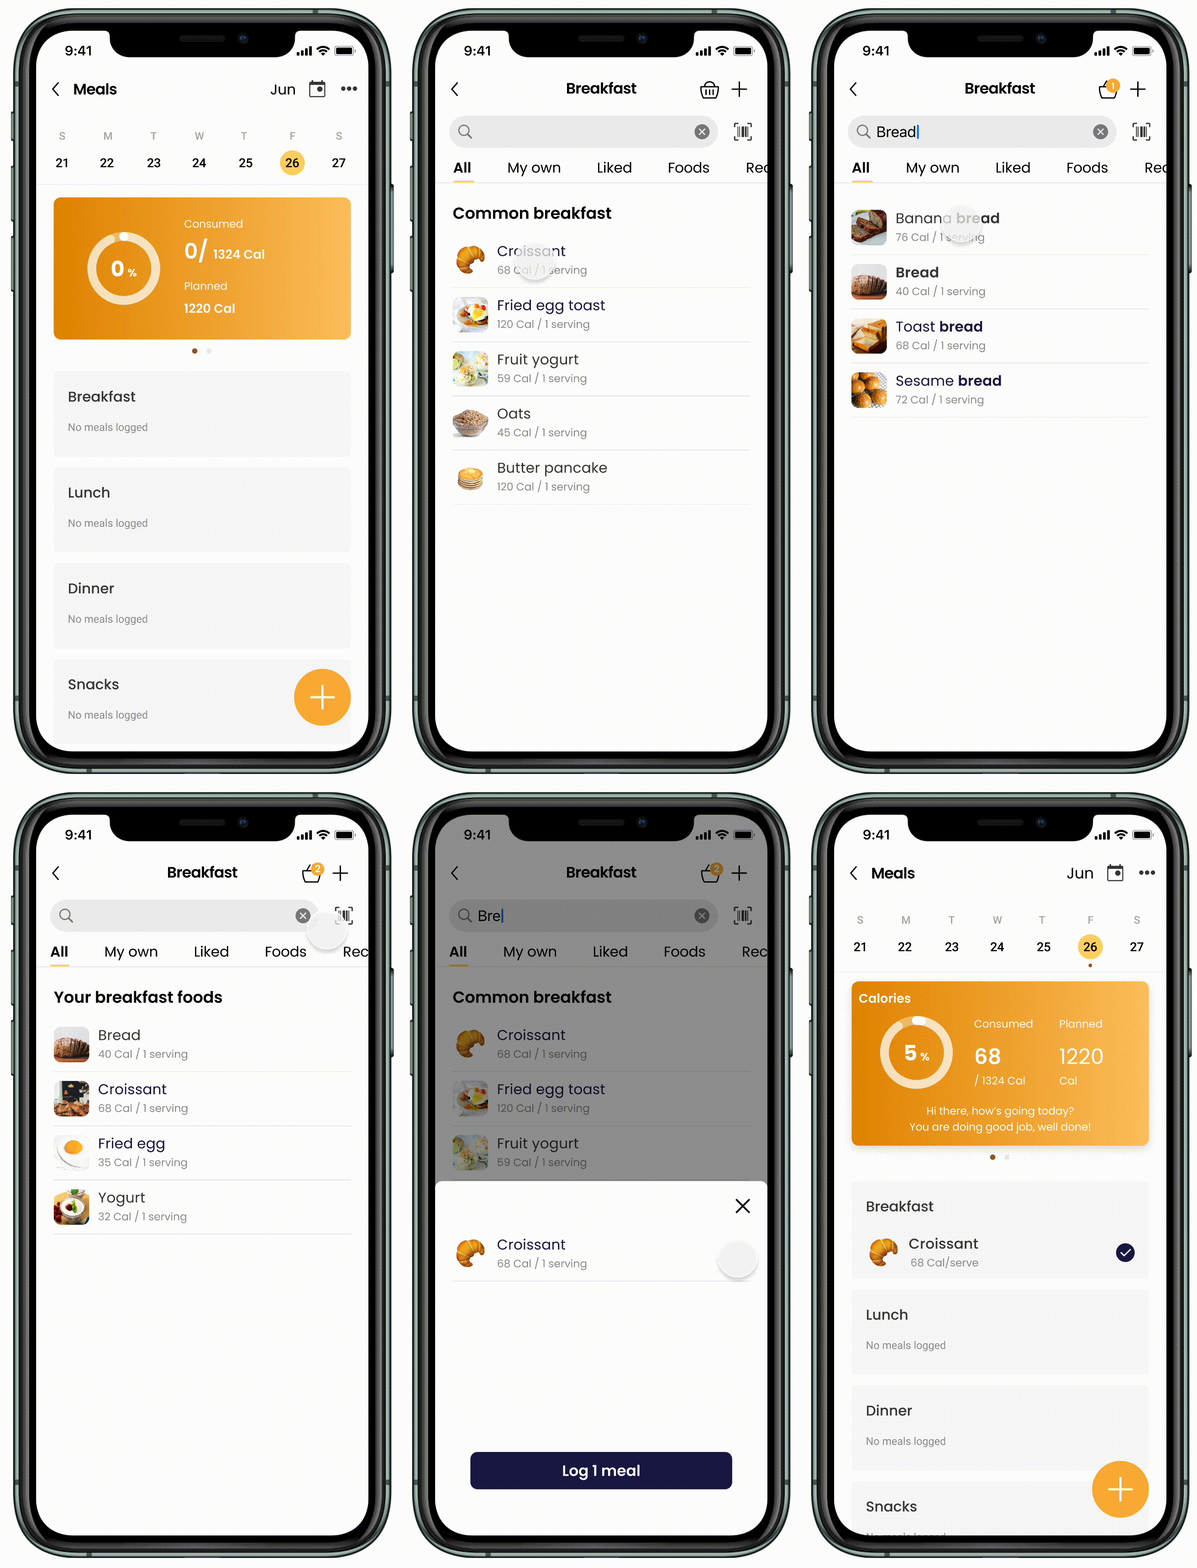
The easily accessed log button allows users to select meals on the main page.
-
Users can log meals by searching food names or scanning the barcode;
-
Users are able to create their own food if is not included in our database.
Calories statistics
-
Macronutrients chart and goal track and present user's nutrition intake;
-
The calories intake chart shows changes and trends on a daily basis or weekly basis.

Observations
After we launched the app, we monitored and analyzed the user data to measure if users are satisfied with the current log flow.
Data analytics
Log meals take 52% of total events that happened on SoFit app in past.

Usage of logging meals from the Homepage log button is 4 times lower than logging meals inside of the Meal module.

Even we have really good results, we still need better metrics to measure if users are satisfied with the current log experience.
Usability Testing
The key research objectives of SoFit users:
-
Observe the starting point when user log meals;
-
Identify and find problems for current log meals flow;
-
Understand users' needs and wants by asking questions, etc.
In the usability tests, I invited 7 new users to test out the current log meals flow, observed their behavior, and noted confusion and complaints. Several issues were identified which wouldn’t have been identified through internal bug testing.
Define problems

Problem:
Direct tap on the meals panel instead of using the big plus button.
-
Only 1 out of 7 use the big plus button to log meals.
-
6 out of 7 users tapped on the meals panel which accidentally check the meals from the meal plan.
Opportunities:
How might we add a log button in each meals panel instead of using the big plus button which causes one more step to log meals?
Problem:
Difficult to understand the meal intake chart and numbers on the chart.
-
All users interested in these statistics and swipe left and right to view more history or current data.
-
6 out of 7 users asked questions about the meaning of the numbers on the chart.
Opportunities:
How might we add one screen to explain the Meal intake statistics to decrease the confusion?


Problem:
Hard to find scan barcode and create your own functions.
We created a task to let users created their own food and log.
-
6 out 7 even didn't know about the function.
We created a task to let users log meal by scan a barcode.
-
1 out of 7 users found the icon besides search bar quickly, others took more than 15 seconds to find the icon.
-
All users successfully scanned a barcode to log food.
Opportunities:
How might we make these two function more obvious and easy to find in search page?
Problem:
After logging meals, no way to change the serving size.
-
5 out 7 users tried to change serving size after they done..
Opportunities:
Users should be able to change serving size at every logging stage.

Ideate & Solution


Allow user change serving size in detail page.
Extra screen to explain the Meal intake statistics
Add a log button in each meal panel

Putting "Scan barcode" option more obvious in search page instead of besides search bar.

Adding "Recent meals" history in search page to help user easily log entire day’s meals from history.
More options replace top right "Plus" button for the Creating your own function.


Measure Success
-
What went well
I validated my design by testing 7 users with an interactive prototype. The 7 users were asked to log meals by scanning barcodes, creating their own foods, retrieving from history and editing logged meals serving size. All of the users were able to complete the tasks without any issues.
-
Data validate
As a result of the iterate, the Log meals event average rate increased from 37.2% to 51.0%


Illustration credit @ Mengwen Yu
